Thinking about selling in Riverhead but unsure where to set your price? You are not alone. Between varied neighborhoods, seasonal demand, and changing buyer preferences, finding the right number can feel tricky. In this guide, you will learn how pricing really works here, what the latest data says, and how to set a confident strategy with a plan to adjust if needed. Let’s dive in.
Quick Riverhead market snapshot
Recent vendor snapshots show Riverhead’s central metrics in the mid six figures, with meaningful variation by submarket. Always pair a number with its source and date so you see the full picture.
- Median sale price: about $580,000 (Redfin, Feb 2026)
- Median days on market: about 50 days (Redfin, Feb 2026)
- Sale-to-list ratio: about 98.8% (Redfin, Feb 2026)
Other sources report different figures because they measure different things at different times. For example:
- Realtor.com (Jan 2026) noted a median home price near $655,000 and about $425 per square foot.
- Zillow’s ZHVI (Feb 28, 2026 update) put the average home value near $607,684, while its median list price was about $698,963.
Why the spread? Redfin tends to reflect MLS closed sales. Zillow’s ZHVI is a modeled index, and list prices reflect current asking levels. Realtor.com publishes a blend of metrics and neighborhood snapshots. Your home’s neighborhood mix and features will matter more than a single citywide median.
For context on higher-tier submarkets, North Fork and other East End reports showed elevated medians and tight inventory in late 2025. Local reporting flagged record North Fork medians around $999,000 with historically low inventory in early 2026, which helps explain the premium for waterfront and vineyard-adjacent areas compared with Downtown Riverhead’s more affordable stock. See the coverage on record North Fork medians and inventory constraints in the Riverhead News Review.
What drives demand in Riverhead
Riverhead and the North Fork attract a mix of year-round local buyers, Long Island and NYC movers seeking space, and seasonal or second-home buyers. That mix creates a wide price band. A home that appeals to local primary-residence budgets may compete in a different lane than a waterfront listing geared to second-home buyers.
Lifestyle and amenity demand also shape pricing. Buyers consistently value outdoor space, flexible work areas, and turnkey condition. At higher price points, direct water access, docks, and legal guest or ancillary units can command a premium. When you price, account for these features alongside location and condition.
How an agent sets your price
Pricing is not a guess. Here is the step-by-step process I use to build a credible listing range and a primary list price.
1) Pull recent local sales
- Best comps are in the same neighborhood, with similar lot size, within the same school district, and sold in the past 3 to 6 months when possible. Appraisers and agents prefer recent closed sales, while also reviewing pending and active listings for context. For a consumer-friendly overview of this approach, the NAR pricing guide is helpful.
2) Adjust for differences
- We adjust for beds, baths, finished square footage, lot size, condition and renovations, septic vs. sewer, parking, legal accessory units, and waterfront or water access. These adjustments create a realistic apples-to-apples view.
3) Layer market context
- Inventory, days on market, sale-to-list ratios, and recent buyer behavior guide whether we sit at the top, middle, or bottom of your comp range. If similar homes are drawing multiple offers in week one, we may lean higher. If inventory is stacking up, we price more conservatively.
4) Add local intelligence
- We consider real-time buyer traffic, competing listings about to hit, known repair or title issues, and neighborhood events. This is where on-the-ground knowledge adds value beyond raw MLS numbers.
5) Present a documented strategy
- You should see a recommended list price range, the comps and adjustments behind it, and a “Plan B” with clear triggers and timing for a price or positioning change if early activity lags.
A simple example CMA grid
This mock example shows how adjustments work. Numbers are illustrative only.
| Status | Address (example) | Sale/Ask Price | Beds/Baths | Sq Ft | Lot | Key Notes |
|---|---|---|---|---|---|---|
| Sold | 12 Bayview Ct | $615,000 | 3/2 | 1,700 | 0.30 ac | Updated kitchen, near bay access |
| Sold | 44 Maple Ln | $580,000 | 3/2 | 1,600 | 0.25 ac | Standard finishes, garage |
| Sold | 98 River Ave | $545,000 | 3/1.5 | 1,500 | 0.20 ac | Older roof, needs bath refresh |
| Active | 205 Downtown Rd | $569,000 | 3/2 | 1,520 | 0.15 ac | Walkable location, smaller lot |
| Expired | 7 Harbor Cir | $679,000 | 3/2 | 1,650 | 0.25 ac | Overpriced vs. comps, 90 DOM |
Adjustment examples for your subject home (3/2, 1,650 sq ft, 0.25 ac, mid-level updates):
- +$40,000 for direct water access versus your canal-view only.
- -$25,000 for an older kitchen and systems compared with updated comps.
- +$10,000 for larger lot or garage, -$10,000 for smaller lot or no garage.
After applying adjustments, we would likely target a pricing band near the adjusted median of the sold comps, then weigh current actives and buyer traffic to choose the list price.
Timing and seasonality
If your timeline is flexible, spring tends to be the strongest listing window on Long Island, with increased buyer activity from late February through May. National seasonality research summarized here explains why spring and early summer often bring more exposure and better odds of multiple offers. See a concise overview of best months to sell in this seasonality explainer.
That said, off-season listings can still win if you have limited competition or a standout location or feature. The key is to price to the market you are in today, not last spring.
Pre-list updates that move price
In most cases, targeted, market-appropriate updates deliver the best short-term return. Common winners include:
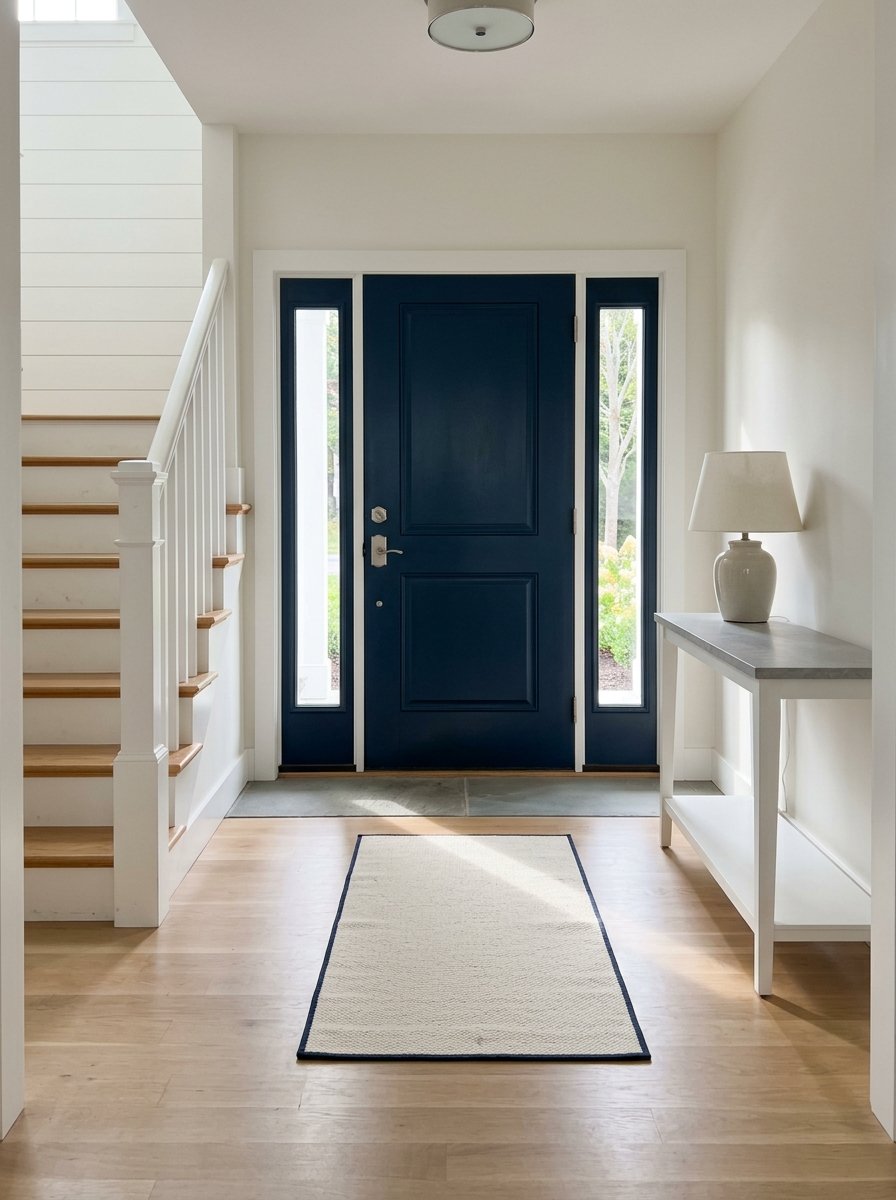
- Fresh interior paint in neutral tones
- New or refreshed entry door and hardware
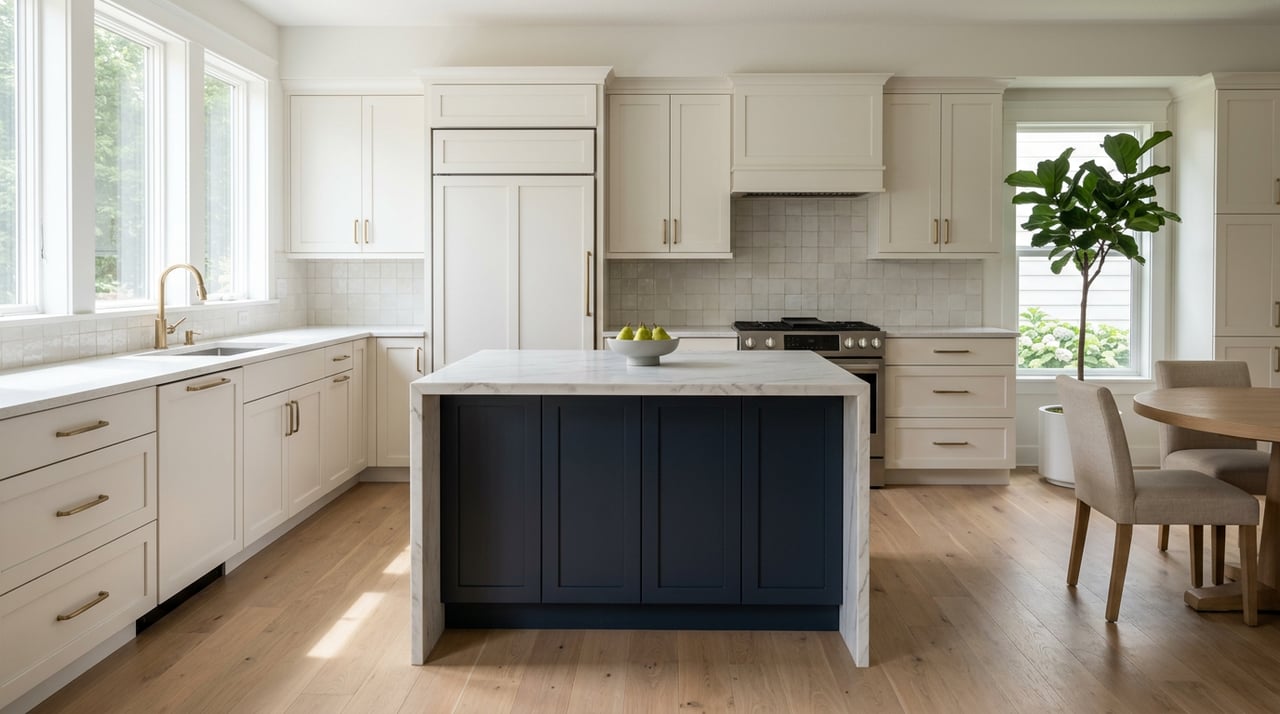
- Minor kitchen and bath refreshes (lighting, fixtures, cabinet paint)
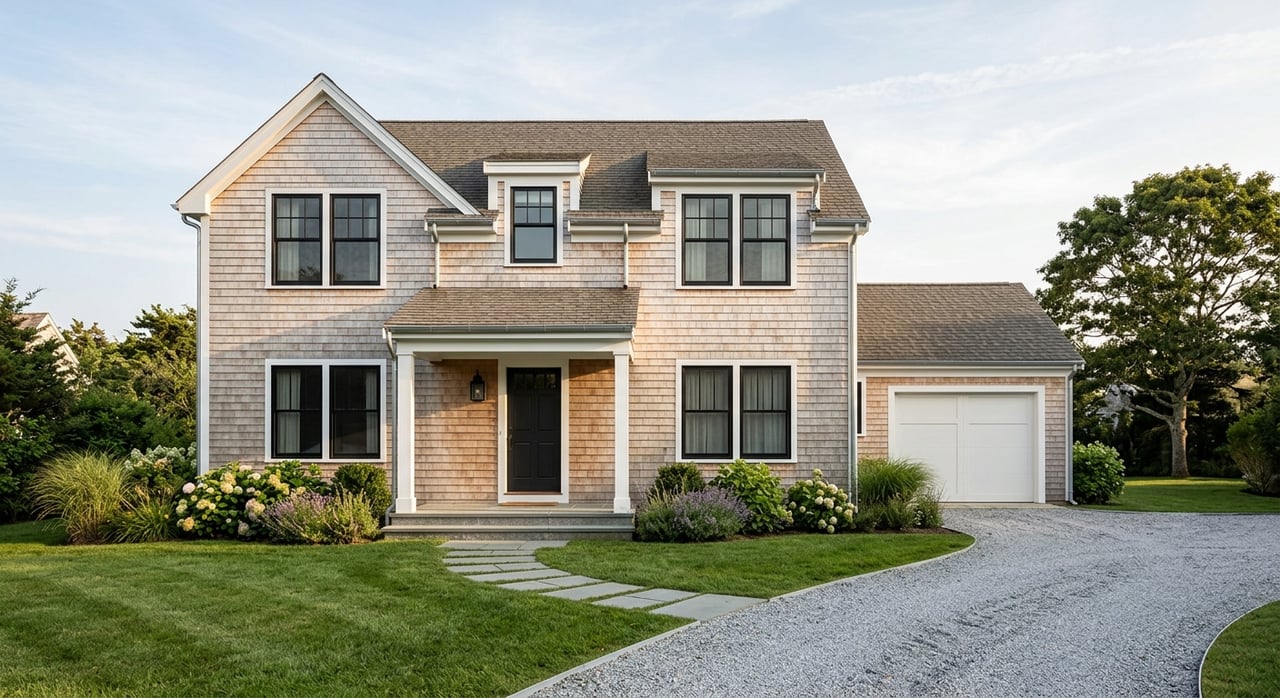
- Curb-appeal boosts (landscaping tidy-up, power wash, mulch)
Industry cost-versus-value research shows these lighter projects often outperform large, expensive overhauls on near-term ROI. For a helpful reference on typical returns, review this cost-vs.-value overview.
A pre-listing inspection can surface small fixes before buyers see them, and thoughtful staging with professional photos expands your buyer pool and can shorten days on market. For a quick prep checklist, take a look at this pre-list guide.
Ownership costs to document upfront
On the East End, flood risk and insurance costs matter. Being transparent about these items helps buyers price the home correctly and reduces low offers built on unknowns. Before you list, gather and share:
- FEMA flood map status and any elevation certificates. Start with the FEMA Flood Map Service Center.
- Local flood or coastal notices. Suffolk County maintains resources and risk updates on its flood risk page.
- Septic or well documentation, recent service records, and any permits for accessory units.
- Recent tax bills and average utility costs.
Waterfront and flood-zone pricing can be nuanced. Some coastal properties trade at a premium because of location, even if insurance costs are higher. For a data-driven look at coastal sale comparisons on Long Island, see this PropertyShark analysis of flood-zone pricing.
Pricing strategies that work
- Price at market. This aims to sell within the normal marketing window and is often the best choice in a balanced market.
- Price slightly below market. This can spark a bidding dynamic when demand outstrips nearby supply. Use with care and pair it with strong staging and marketing.
- Price above market. This leaves room to negotiate but can reduce early showings. In Riverhead, recent snapshots show median days on market near 50 days as of Feb 2026. Overpricing increases the risk of sitting through multiple price cuts.
Your day-one launch and 14-day review
The first two weeks are critical. Most serious buyers set alerts and look at new listings quickly. Here is the standard plan I use so you hit the ground running:
- Day-one launch: Complete prep, pro photos, floor plan, and a feature-forward description. Verify flood/septic/tax docs are available for buyers.
- Week 1: Host early showings and track online views, saves, and inquiries. Gauge buyer feedback on price and condition.
- Week 2: Compare your traffic and interactions with direct comps. Are you leading, matching, or lagging? If lagging, we meet to review pricing and positioning.
At the end of week two, we decide together whether to hold, tweak marketing, or make a measured price change.
When to adjust price
Have a clear “Plan B” before you list. Common triggers include:
- Two consecutive weeks where your showings, saves, and inquiries trail similar listings.
- Feedback consistently citing better value at nearby addresses.
- Nearby price drops changing buyer expectations.
- No offers after meaningful traffic in the first 7 to 14 days.
Adjustments do not need to be dramatic. A modest price shift, improved staging, new lead photo, or a targeted open house can reset momentum.
Neighborhood nuance matters
Downtown Riverhead often prices below the North Fork or waterfront sections of town because of different housing stock and lot sizes. Meanwhile, homes with direct water access, docks, or vineyard adjacency tend to pull higher prices due to lifestyle value and limited supply. When we build your CMA, we will focus on your immediate micro-area so your price reflects the buyers you will actually meet.
Ready for a personalized price range?
If you are thinking about selling this season, I will prepare a dated Comparative Market Analysis tailored to your block and home. You will get a recommended list price range, the comps and adjustments behind it, and a short list of pre-list fixes most likely to improve your net. I offer this in English or Spanish, with clear next steps and timelines. When you are ready, reach out to Sophia Walker - NY to get started.
FAQs
How long does it take to sell a Riverhead home in 2026?
- Recent snapshots showed a median around 50 days on market as of Feb 2026 (Redfin). Your timing will depend on price, condition, location, and season.
Do waterfront and flood zones raise or lower my price?
- It depends. Waterfront can command a premium for access and views, while flood insurance and risk may temper some buyers; check your FEMA map status and insurance options.
Is spring really the best time to list in Riverhead?
- Spring typically brings stronger buyer activity and better odds of multiple offers on Long Island; if listing off-season, align price and marketing to current demand.
Should I price above market to leave room to negotiate?
- You can, but it often reduces early showings and may lead to longer days on market; pricing at market usually attracts more serious buyers faster.
What do I get with a free home valuation from Sophia?
- A dated CMA with hyperlocal comps, an evidence-backed list price range, a 14-day review plan, and a short checklist of targeted pre-list updates, delivered in English or Spanish.